☀️ Solar Flare Classification
🛰️ GOES X-Ray Detection System
GOES-16 (GOES-East)
Launched: November 19, 2016
Position: 75.2°W Geostationary Orbit
Altitude: 35,786 km (22,236 mi)
Instrument: EXIS (Extreme Ultraviolet and X-ray Irradiance Sensors)
Coverage: Eastern Americas, Atlantic Ocean
X-Ray Bands:
- • XRS-A: 0.05-0.4 nm (soft X-rays)
- • XRS-B: 0.1-0.8 nm (hard X-rays)
GOES-18 (GOES-West)
Launched: March 1, 2022
Position: 137.2°W Geostationary Orbit
Altitude: 35,786 km (22,236 mi)
Instrument: EXIS (Extreme Ultraviolet and X-ray Irradiance Sensors)
Coverage: Western Americas, Pacific Ocean
X-Ray Bands:
- • XRS-A: 0.05-0.4 nm (soft X-rays)
- • XRS-B: 0.1-0.8 nm (hard X-rays)
How X-Rays Are Detected: The EXIS sensors measure solar X-ray irradiance in two wavelength bands. When a solar flare occurs, the sudden increase in X-ray flux is detected within seconds. Data is transmitted continuously to NOAA's Space Weather Prediction Center, where it's processed and classified (A, B, C, M, or X class) based on peak flux intensity in the 0.1-0.8 nm band.
📈 Solar X-Ray Statistics & Historical Data
📊 Detailed X-Ray Data & Reports
📊 GOES X-Ray Flux - 6-Hour Real-Time (NOAA Data)
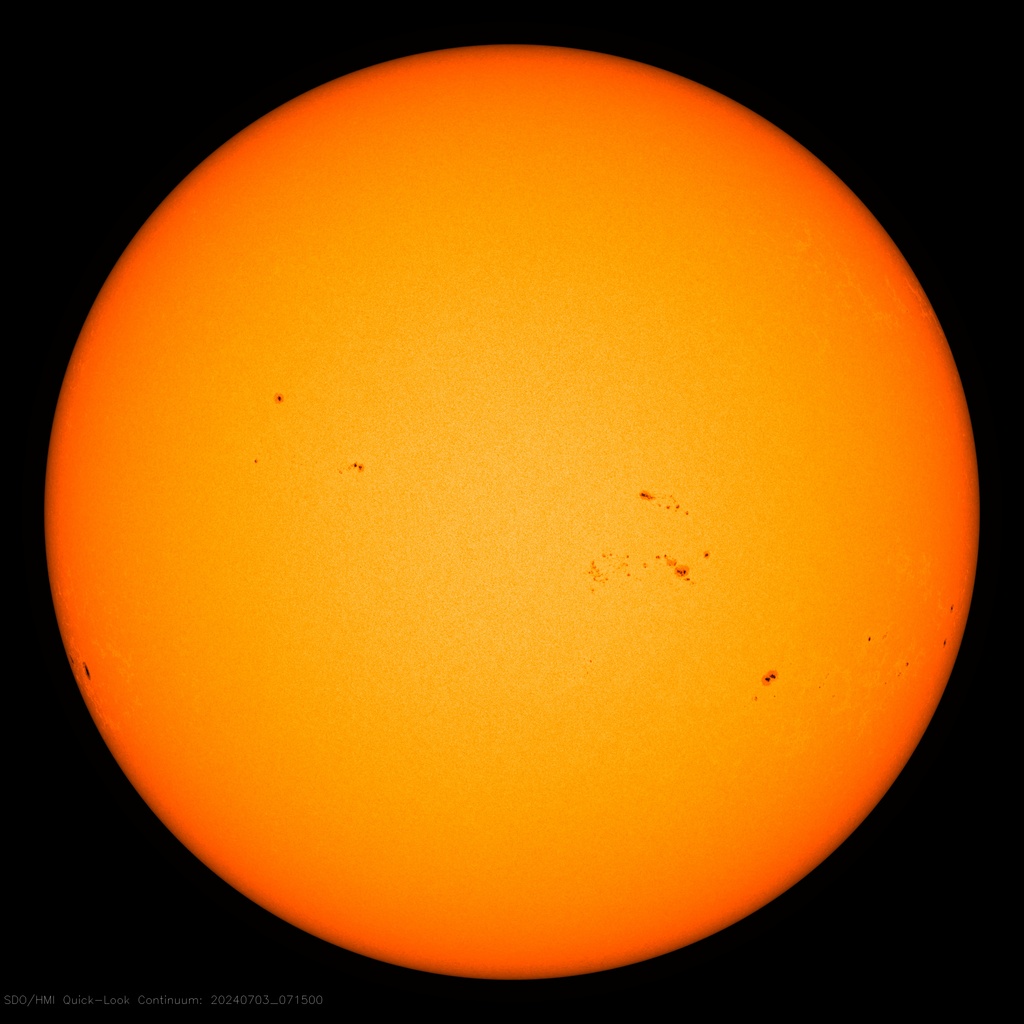
🧲 Solar Magnetic Field (HMI Continuum)
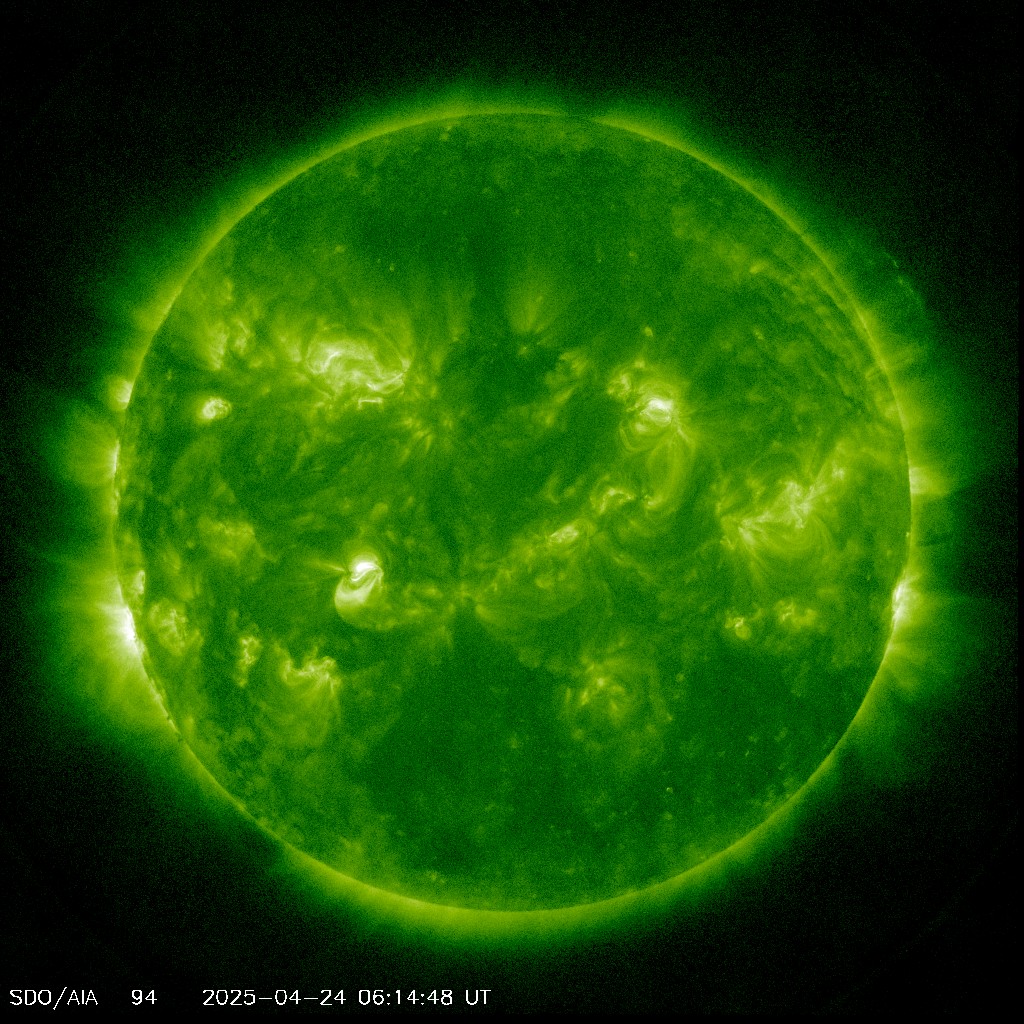
☀️ Solar Corona (94 Å EUV)
🔬 How Solar X-Rays Are Detected
1. X-Ray Generation at the Sun
Solar flares occur when magnetic energy in the Sun's atmosphere is suddenly released. This heats plasma to 10-40 million K, emitting intense X-rays that travel at light speed (8 minutes to Earth).
2. Satellite Detection
GOES satellites orbit at 35,786 km altitude, outside Earth's atmosphere which blocks X-rays. The EXIS instrument uses ionization chambers and photodiodes to measure X-ray intensity in real-time.
3. Data Transmission & Processing
X-ray flux data is transmitted every second to NOAA's Wallops Command and Data Acquisition Station in Virginia, then relayed to the Space Weather Prediction Center in Boulder, Colorado.
4. Classification & Alerts
Flares are classified by peak flux in the 0.1-0.8 nm band: A (10⁻⁸ W/m²), B (10⁻⁷), C (10⁻⁶), M (10⁻⁵), X (≥10⁻⁴). Automated alerts notify operators of power grids, airlines, and GPS systems.